TFT-IR · Temperature forecasting
Know when your ice road opens, weeks ahead
Each year, ice roads reach their regulatory requirements for opening on a different date, sometimes months apart. Crews waiting on the freeze burn real money. beadedcloud forecasts each site weeks ahead, as a date with a range, so mobilization goes on the schedule.
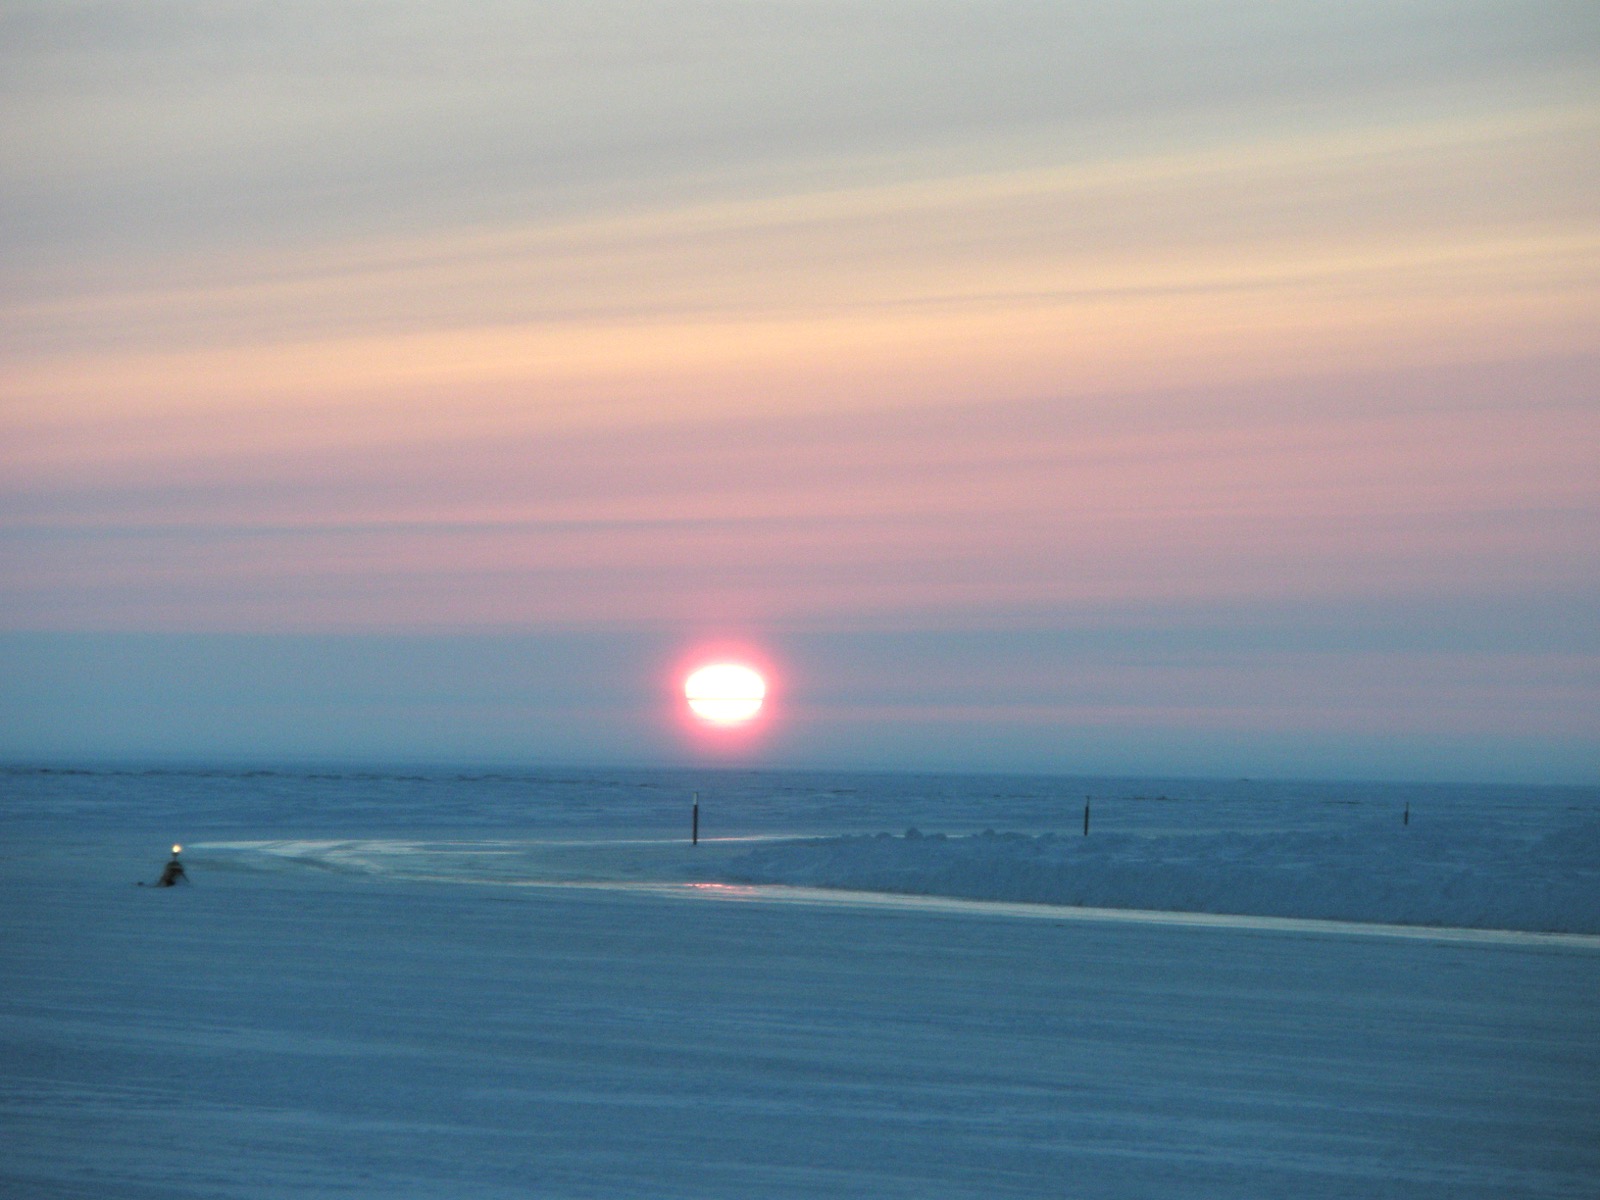
When does your road open?
Every stage of ice road construction unlocks at a ground temperature. Drag the threshold or pick a phase, and the forecast band turns cold into a date range for it: the observed line is what the site has measured, the shaded band is the 30-day forecast.
Illustrative example with synthetic data, not a live site. A real forecast runs on each site's own sensors via the TFT-IR model.
0 °C
Pre-packing
At 0 °C crews start compacting snow over the route with snow machines and drag sleds, driving frost deeper.
-3 °C
Misting
At -3 °C water misting begins, building the first ice layers onto the packed surface.
-5 °C
Build and open
At -5 °C at 30 cm depth, the Alaska DNR coastal-area threshold, full ice construction and tundra travel can begin.
Why measure the tundra at all?
The thresholds exist to protect the ground itself. Travel on unfrozen tundra damages the vegetation and soils that hold the Arctic coastal plain together, which is why the State of Alaska requires a permit for all off-road travel on North Slope state land and closes the tundra entirely from break-up to mid-July. Frozen, snow-covered ground carries heavy traffic without a trace. Measuring ground temperature is how operators and regulators know the tundra is ready: roads open only when the ground can take them, and every trip a forecast replaces is one less trip on the tundra to check.
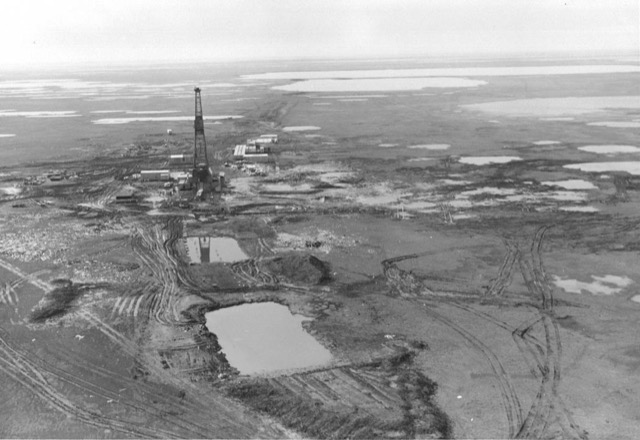
What is the tundra doing right now?
The season starts here: daily average air temperature and snow depth from the nearest public station on the North Slope, live. When the freezing days start stacking up, the forecast is what turns that cold into a construction date.
How the forecast works
Step 1
Sensors on the route
beadedstream digital temperature cables measure air, surface, and ground at multiple depths along the route, in centerline and reference pairs. Solar plus battery, cellular backhaul, operates below -40 °C, transmitting four times a day.
Step 2
30-day forecast
A model trained on each site's own history forecasts every sensor 30 days ahead, as a range (10th to 90th percentile). The ground forecast updates as the site weather forecast changes.
Step 3
Set the threshold
Pick any threshold, for example -5 °C at 30 cm, and get the forecast date each site crosses it, plus threshold tables for permit reporting.
How close does the forecast get?
In a North Slope ice road trial, one week before the ground reached -5 °C the forecast was within 1 day of the actual crossing, against 8 days of error for the non-ML baseline. The operator obtained its tundra travel opening permit 21 days before the State of Alaska's general opening for the same area.
“We can forecast the date of reaching target ground temperatures to within 6-7 hours which aids with planning. We've been able to get out on tundra 1 to 1.5 months sooner by using temperature sensors for monitoring.”
Questions the forecast answers
When will each road segment be ready to build on, and how confident is that date?
Which road segments are lagging and need extra cooling effort first?
In spring, how long before river crossings close?
When did each site reach each temperature threshold, for the permit report?
What about spring breakup?
The forecast covers breakup too: closing windows and river crossings, so crews and equipment are not stranded.
Next steps
1
Already on beadedcloud
Enable forecasting on your project page, or email support@beaded.cloud and we will turn it on. Forecasts appear after about 10 days of data, and immediately for sites with history.
2
New to beadedcloud
Sensors go in the fall, before the season starts. Email contact@beaded.cloud with your route and we will spec cable sites, loggers, and forecasting together.
3
Doing your homework
Take the case study to your ops meeting, and see the other public sites for what beadedcloud looks like on a live problem.
Want a site like this for your route?
This page runs on the same platform your route would: live sensors, forecasts, thresholds, and reports. beadedcloud builds public and private insight sites for Arctic operators.
More public sites